Reports take days to reconcile
Finance teams match numbers across ledgers, payment platforms and loan systems by hand before every close.
Impact: Slower month-end, more analyst hours spent on reconciliation, and late decisions.
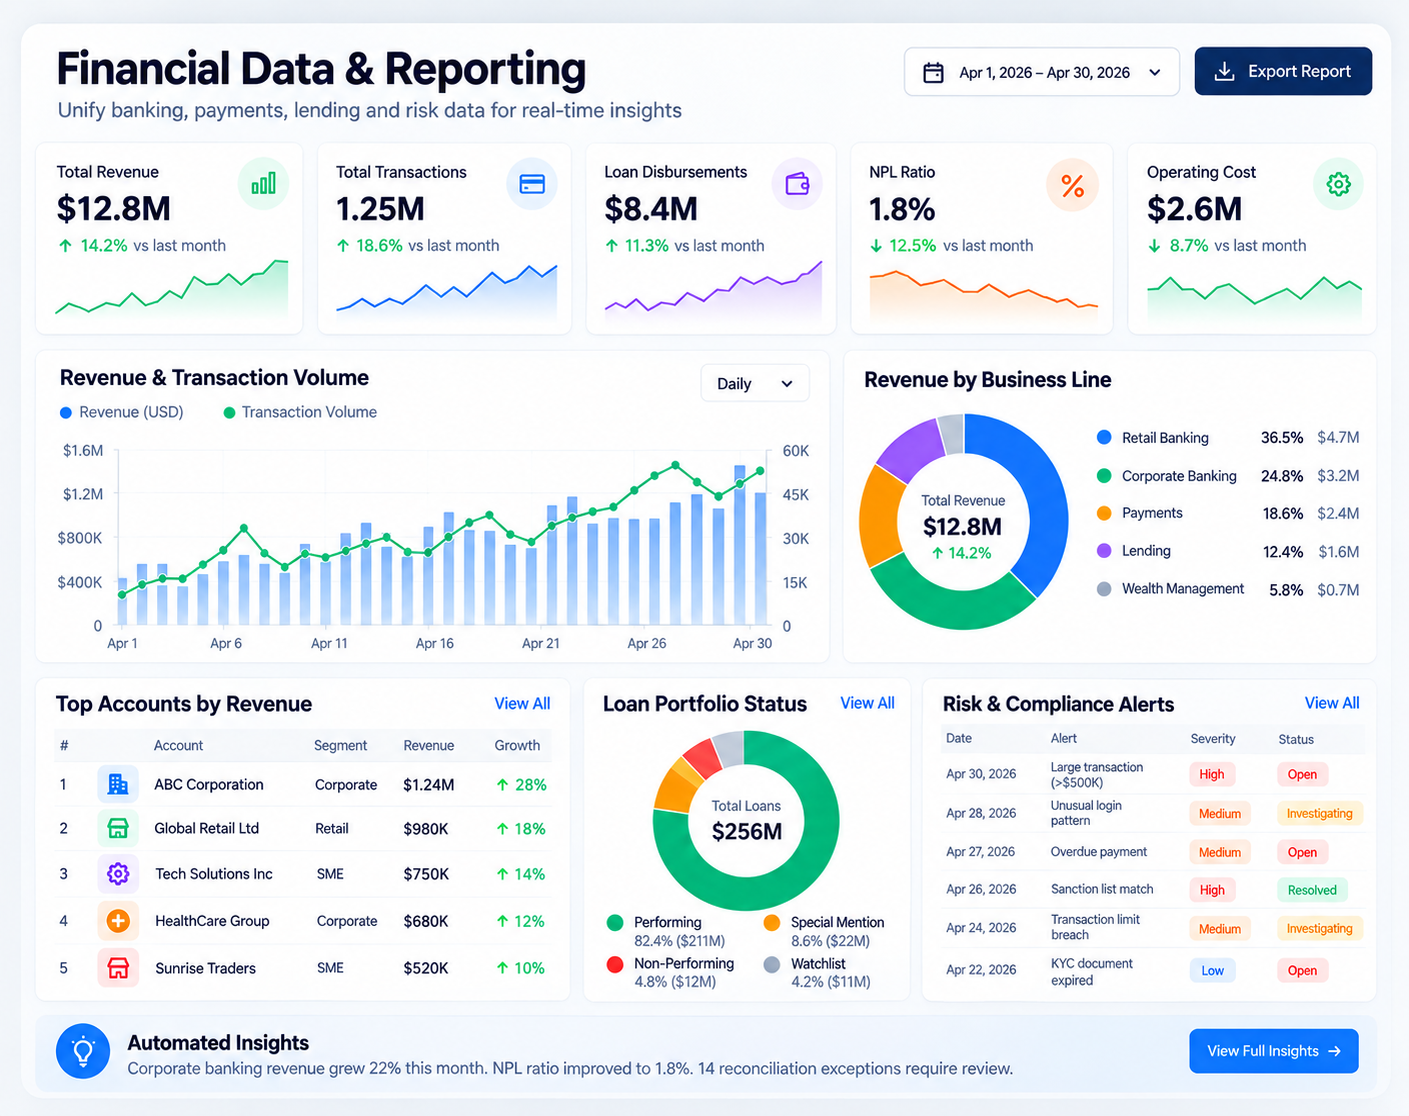
Core banking, payments, lending, reconciliation and risk data often sit in separate systems with different definitions. We design governed data platforms that give finance, risk and operations one reconciled view, and reporting that does not depend on manual spreadsheets.
Why reconciliation keeps failing
Financial data is among the most controlled data in any organisation, and among the most fragmented. Core banking, payments, lending and the general ledger each hold part of the picture, and each uses its own codes, timing and definitions. When finance, risk and operations pull numbers from these systems separately, the figures rarely agree, and the effort spent explaining differences grows with every close.
We design a governed financial data platform that brings these sources together under agreed definitions. Reconciliation rules run on every load, exceptions are routed to named owners, and each reported figure can be traced to its source. For teams already running reconciliation automation, the platform becomes the reliable base underneath it. Institutions that also need fraud and anomaly detection can use the same governed data for those models.
Where the time goes
Finance teams match numbers across ledgers, payment platforms and loan systems by hand before every close.
Impact: Slower month-end, more analyst hours spent on reconciliation, and late decisions.
Risk, finance and operations define the same metric differently, so leadership receives conflicting figures.
Impact: Lost trust in dashboards and repeated debates in management meetings.
Batch loads run overnight or weekly, so exposure, delinquency and unusual activity are visible only after the fact.
Impact: Slower response to credit deterioration and to unusual transactions.
Reports are assembled from extracts, with little lineage showing where each figure came from.
Impact: High effort per filing and weak audit trails when reviewers ask questions.
Source systems
We confirm what each system exposes, how often it can be refreshed and who owns the data, before the design is final.
| System | What it provides |
|---|---|
| Core banking and loan systems | Accounts, loans, repayments and balances |
| Payment and card platforms | Transactions, settlements and chargebacks |
| General ledger and ERP | Journals, cost centres and close data |
| CRM and onboarding tools | Customer and relationship context |
| Risk and collections systems | Exposure, scoring and recovery status |
Delivery plan
Each phase ends with a defined output. Timelines are estimated after the assessment, once sources and scope are confirmed.
We map the core, payment and ledger sources, confirm refresh options, and agree the definitions that finance and risk use for each key metric.
Output: Source inventory and metric dictionary
We define the matching keys, tolerances and exception rules for each reconciliation, and decide which breaks need human review.
Output: Reconciliation rule book
We build the scheduled and change-based loads, the financial data model and the control totals that check every run.
Output: Working data model with control checks
We publish certified dashboards and scheduled report packs, with role-based access for each team.
Output: Dashboards and access matrix
We monitor data freshness and exception ageing, and refine rules after each close with the finance team.
Output: Monitoring pack and improvement log
Platform design
Scheduled and change-based pipelines from core, payment and ledger systems, with reconciliation checks at load.
A warehouse or lakehouse with governed financial data models, agreed metric definitions and historical snapshots.
Data quality rules, reconciliation totals and lineage so every reported figure can be traced to its source.
Certified dashboards for finance, risk and management, plus scheduled report outputs for regulatory packs.
Controls
Controls are agreed for each project, based on the sensitivity of the data and the rules that apply to your organisation.
Success measures
Each measure is baselined before the project starts, so improvement is shown against your own starting point.
| Measure | How it is calculated | Why it matters |
|---|---|---|
| Days to close | Working days from period end to final reconciled reports | Shows how quickly the business can act on its numbers |
| Unmatched item count and age | Open reconciliation exceptions, grouped by age and owner | Shows whether breaks are being resolved or accumulating |
| Analyst hours per close | Manual hours spent on reconciliation and report preparation | Measures the effort released for analysis |
| Metric agreement | Share of key metrics that match across finance, risk and operations | Shows whether teams are working from one set of numbers |
| Data freshness | Time between a source transaction and its appearance in reports | Shows whether risk and exposure views are current enough to act on |
Illustrative scenario
This is an illustrative scenario, not a verified client result. Measured outcomes are shared only from real projects, with their baseline and method.
The challenge
A lender reconciles loan repayments, payment settlements and ledger entries across three systems. The process depends on spreadsheets and runs for several days after each close.
The approach
What we measure: Days to close, unmatched item count and age, analyst hours per close. Measured against a baseline taken before the project starts.
What you receive
Questions finance leaders ask
A data audit of the core, payment and ledger sources, followed by agreement on the metric definitions that finance and risk need. That agreement is what makes the reports trustworthy.
Where the systems expose the data we need through extracts, APIs or database access, reconciliation rules can be automated with exception queues for unmatched items. Feasibility is confirmed during the assessment.
It can produce the data and scheduled reports that regulatory packs need, with lineage for audit. The reporting obligations themselves depend on your jurisdiction and should be reviewed with your compliance team.
With role-based access, masking of personal identifiers outside production, retention rules and audit logs. The controls are agreed for your environment before build starts.
A first reconciliation or reporting use case is usually the fastest route to visible value. The timeline depends on source access, the number of systems and the testing your finance team requires, and it is estimated after the assessment.
Not necessarily. The platform provides the governed data and calculations. Existing BI tools can often continue to be used on top of it, where they meet your access and performance requirements.
A data platform assessment maps your systems, the reports that matter and the decisions they support, then gives you a practical first step.
Tell us about your business goals and challenges. Our experts will get back to you within one business day with a free, no-obligation consultation.
100+ Projects Delivered
5+ years expertise
Free Consultation
Fill out the form and our team will get in touch with you shortly.
Free
Consultation
Quick
Response
Dedicated
Support