The 2026 USFIA Fashion Industry Benchmarking Study reports that 56% of its respondents use AI for demand forecasting and inventory planning, making it the most common AI use in the survey. The study covers a small group of leading companies, so the figure describes surveyed firms, not every fashion company in the United States. For US fashion retailers, the signal is clear: forecasting is where AI is being applied first, and the teams that get it right will have a planning advantage as tariffs, sourcing shifts, and cost pressure continue.
Ask a fashion buyer what keeps them up at night, and the answer rarely starts with technology. It starts with tariffs, with supplier costs, with a drop that did not sell, and with a size run that sold out in the first week. Forecasting sits underneath all of those problems. If the forecast is wrong, every decision that follows is built on the wrong number. If you want outside help building a forecast, our AI and machine learning services cover forecasting, model development, and monitoring.
That is why the latest benchmarking data from the fashion industry matters. The United States Fashion Industry Association (USFIA), working with University of Delaware researchers, publishes an annual survey of executives at fashion brands, retailers, importers, and wholesalers. Its 2026 edition, released in July 2026, reports that AI is already being used across forecasting, risk management, and sourcing decisions.
This article explains what the study says, how to read the headline statistic without overstating it, why demand forecasting is at the center of the 2026 agenda, and how US fashion retailers can turn this trend into practical planning. It also covers the data you need, the implementation challenges to plan for, and the way to measure whether a forecasting program is working.
What the 2026 USFIA study reports
The USFIA Fashion Industry Benchmarking Study is an annual look at how US fashion businesses see their markets, sourcing, and operations. The 2026 release highlights several findings that matter for planning:
- AI for demand forecasting and inventory planning: 56%. This is the most common AI use reported in the survey.
- AI for sustainability tracking, risk management, and sourcing strategy: 50%. Half of respondents use AI for these areas, which shows that forecasting is part of a wider planning effort.
- Tariffs and trade policy: 92%. That share of respondents rated protectionist US trade policy and tariff uncertainty as one of their top two business challenges in 2026.
- Hiring plans: 87%. About 87% of companies plan to increase hiring over the next five years.
- Forced-labor risk: from tenth to sixth. Managing forced-labor risk rose from tenth place in 2025 to sixth place in 2026, which points to a stronger focus on supply chain responsibility.
Taken together, these figures describe an industry that is planning under pressure. Trade policy is the main concern, companies are investing in people, and they are using data tools to manage risk and inventory at the same time.
FashionUnited's coverage of the study adds context. It describes a shift away from spreading orders across many new suppliers and toward consolidating relationships with a smaller set of partners. Consolidation can simplify sourcing, but it also makes each supplier relationship more important, and it makes demand planning across fewer, larger programs more consequential.
How to read the 56% statistic
A headline statistic is only as useful as the method behind it. The most important thing to understand about the 56% figure is its denominator.
The figure is a share of respondents to the USFIA survey. It is not a count of all fashion companies in the United States, and it is not a measure of how many companies have deployed an AI forecasting system in production. Several details shape how it should be used:
- The sample is small. FashionUnited's coverage describes the survey as drawing on about 30 leading companies. A survey of this size can show direction, but it cannot be generalized to the whole industry without caution.
- The respondents are leaders. The USFIA describes its respondents as executives at fashion brands, retailers, importers, and wholesalers. These are not randomly chosen businesses. They are engaged organizations that take part in an industry study, which often means they are more active in planning and technology than the average company.
- "Use AI" can mean many things. A company that uses AI to summarize sales reports and a company that runs a size-level forecasting model may both answer yes. The survey question sets the threshold, and the threshold may differ from what a buyer means by an AI forecasting program.
- The exact methodology matters. To report a precise number with confidence, read the full methodology section of the study, including the sample size, the response rate, and the exact question wording. At the time of writing, the summary pages did not state the respondent count or the full question text.
A responsible way to present the statistic is this: "In the 2026 USFIA benchmarking study, 56% of respondents said they use AI for demand forecasting and inventory planning." That sentence is accurate, specific, and clear about who was asked. A sentence such as "56% of US fashion companies use AI for forecasting" is not supported by the data and should be avoided.
The distinction matters for your own planning, too. If you use the study as a benchmark, ask whether your competitors are in the same group of leading companies, and whether your definition of "using AI" matches the one in the survey. The honest comparison is between your current process and a documented pilot, not between your business and a headline number.
Why demand forecasting is at the center of the 2026 agenda
Forecasting connects several of the industry's biggest concerns. Consider how each one depends on the forecast.
Tariffs change the cost of every order. When duties shift, the landed cost of a style changes, and so does the economic case for a larger or smaller buy. A forecast that can be rerun quickly under different cost assumptions helps buyers decide how much to commit before the trade environment moves again.
Sourcing consolidation raises the stakes. When a retailer relies on fewer suppliers, a forecast error can strain a supplier relationship, trigger minimum order issues, or leave the business short of a key product. Forecasts that are shared with suppliers, and that show the range of likely outcomes, support better planning on both sides.
Risk management depends on demand visibility. The 50% of respondents using AI for risk management and sourcing strategy are, in effect, asking the same question forecasting asks: what is likely to happen, and how much uncertainty is there? A demand forecast with a clear range is one of the most practical inputs to a risk model.
Hiring plans need better skills. A company planning to hire more people is also signaling that analytical roles will matter. Teams that can build, read, and challenge a forecast will be better placed to use new tools, and to explain their decisions to buyers and finance leaders.
In short, the forecast is no longer a back-office spreadsheet. It is a shared input to pricing, sourcing, risk, and staffing decisions.
Business use cases for AI demand forecasting in fashion
Fashion teams can use AI forecasting in several concrete ways. We cover the buyer side of this in more depth in our guide to AI demand forecasting for fashion retailers. Each use case has a different horizon and a different level of detail.
Buy planning. The most valuable use is setting the depth of each style before a drop. A forecast range, rather than a single number, lets the team commit a smaller initial buy and plan a second order for styles that sell well. The forecast should be shown at the style level, with the size and color split available for review.
Replenishment. For core styles that repeat each season, the forecast drives reorder timing and quantities. The goal is to reorder before a best-selling size runs out, without building up stock in slow sizes. Replenishment works best when the forecast is refreshed weekly, using the latest sell-through and stock position.
Markdown planning. A forecast of sell-through helps decide when a price change is needed, and how deep it should be. Acting early, with a smaller markdown, usually protects more margin than waiting until the end of the season. The forecast should be tested against past markdown periods, so that price effects are separated from demand.
Allocation. Once the total buy is set, units must be placed where they will sell. Store and channel forecasts help decide where to send inventory first, and where to hold back stock for later. This is especially important when a retailer operates both stores and an online channel, because the same style can sell very differently in each.
Scenario planning under tariff changes. Because trade policy is the top concern in the study, some teams are using forecasts in scenario planning. A forecast that can be rerun under different cost and availability assumptions helps buyers see how a change in duties would affect the optimal buy, and where it would make sense to shift volume.
Each use case depends on the same core asset: a forecast that buyers trust, understand, and can act on.
The data a fashion forecast needs
Fashion forecasting is only as good as the data behind it. Many retail systems were built to track totals, not the detail that a size-and-color forecast requires. The table below lists the data that matters most.
| Data | Why it matters | Common source |
|---|---|---|
| Sales by style, size, color, store, and day | The core signal, at the level buyers decide | POS, e-commerce orders, ERP |
| Inventory on hand and stockout records | Separates low demand from lost sales | Inventory or warehouse system |
| Product attributes (category, fabric, fit, price band) | Lets new styles borrow patterns from similar ones | Product information system |
| Promotions, discounts, and markdowns | Explains spikes and dips in sales | Pricing and marketing calendars |
| Returns, exchanges, and cancellations | Converts gross sales into net demand | Order management and returns systems |
| Drop calendar and launch dates | Sets the timing of demand | Merchandising plan |
| Supplier lead times and minimum order quantities | Sets how far ahead the forecast must look | Procurement system |
| Landed cost and duty assumptions | Connects the forecast to trade policy scenarios | Sourcing and finance systems |
Three data issues deserve special attention.
Stockouts. When a size sells out, its recorded sales drop to zero even though demand may be higher. If the model learns from those zeros, it will repeat the shortage. Flag every stockout by size and location, and treat those periods as censored data rather than true low demand.
Returns and exchanges. An exchange from medium to large can look like one sale of each size. Returns also add units back to inventory, sometimes weeks later. Decide how each event is counted, and apply the same rule across the business.
Style codes. A style that changes color, fabric, or name may be recorded as a new product. Map old and new codes so that real history is not lost, and so that a new style is not wrongly matched to an old one.
Implementation challenges to plan for
Most forecasting programs in fashion stall for reasons that have little to do with the model. The challenges below are common, and each one has a practical response.
Inconsistent codes across systems. The same style may have different SKU or size codes in the merchandising, warehouse, and e-commerce systems. Start with a mapping exercise, and assign an owner to keep it current.
Thin history for new styles. New and short-lifecycle styles have little data of their own. Use cold-start methods that match new styles to similar past styles, and keep the forecast range wide until the style has its own history.
Buyer trust. Buyers will not use a forecast they cannot question. Show the range, the reason codes, and the main drivers behind each number. Record every override, with a short explanation, so the team can see when judgment improves the result and when it does not.
Changing trends and policy. Customer preferences shift, and trade policy can change costs quickly. Plan a regular retraining schedule, and rerun the forecast when a major input changes, such as a duty rate or a supplier's lead time.
Limited time for data work. Data preparation takes time, and it competes with the buying calendar. Start with one category and one season. A focused pilot shows value sooner than an attempt to fix every system at once.
Governance and privacy. Customer-level data, when used, needs appropriate access controls and retention rules. Forecasting usually works with aggregated sales, which reduces privacy risk, but the same care applies to any customer data that is used.
A step-by-step plan for US fashion retailers
The following sequence is practical for a US fashion business that wants to move from spreadsheets to an AI-supported forecast.
Step 1: Define the decision. Write down which buying decision the forecast will support, the forecast horizon, the level of detail, and the person who will act on it. A forecast that answers a clear question is easier to build and easier to trust.
Step 2: Audit the data. Check the sales, inventory, promotion, and returns data for the chosen category. Look for stockouts, style code changes, and gaps in the calendar. Fix the most damaging problems first, and document the rules you apply.
Step 3: Build a baseline. Measure the current forecast accuracy using last season's buys. The baseline lets you prove that a new approach is better, rather than assuming it.
Step 4: Layer the forecast. Forecast total style demand first, then split it by size, then by color, then by store or channel. Layering keeps the forecast aligned with how buyers think, and makes it easier to find where errors come from.
Step 5: Handle new styles. Use cold-start matching for new items, based on attributes and early sales curves of similar styles. Set a clear point at which the style's own history takes over.
Step 6: Connect the forecast to the buy. Translate the forecast range into buy depth, size split, and safety stock. Include supplier minimums and lead times, and show buyers how each number was reached.
Step 7: Run in parallel. For one season, let buyers use their normal process while the forecast runs alongside it. Compare the two, and review the differences together.
Step 8: Expand with discipline. Once the results hold, extend the approach to more categories. Keep the override log, retrain on a schedule, and monitor for data failures and bias.
How to measure whether it is working
Forecast accuracy is important, but it is not the goal. The goal is better buying decisions. Measure both.
- Forecast error and bias. Track error at the style and size level. Bias shows whether the forecast runs consistently high or low, which causes repeated overstock or stockouts.
- Overstock at the end of the season. Measure the units and the value left in stock.
- Markdown rate and full-price sell-through. These show whether the buy was right and whether pricing was timed well.
- Stockout days in core sizes. A forecast that reduces overstock but creates shortages in best-selling sizes has not succeeded.
- Inventory turns. Faster turns usually mean capital is being used more efficiently.
- Buyer adoption. Track how often buyers use the forecast, and how often they override it. Both numbers tell you whether the tool is trusted and whether it is missing something.
Compare these measures with the same period in earlier seasons, or with a parallel group that continues the old process. Read them together. A season with low overstock but many core-size stockouts is not a success.
An illustrative example: a contemporary label
The following scenario is hypothetical. It shows how the approach can work in practice. It does not describe a specific company or result.
Imagine a contemporary apparel label with a Manhattan store and an online shop. It plans four drops a year and keeps a set of core styles that return each season. Its buyers rely on last season's sales, adjusted by judgment. Each season ends with too many large sizes and not enough small and medium sizes for its best sellers, and it takes deep markdowns on trend items.
The label starts with one category and one season. It audits two seasons of size-level sales and stockout records, and it cleans the style codes. It builds a layered forecast: style total, then size split, then store split. For new styles, it matches each one to similar past styles.
The team runs the forecast alongside its normal process for one drop. Buyers review the forecast range before each order and record their overrides. After the season, the results show lower overstock in core styles and fewer stockouts in the sizes that sold fastest. For trend items, the label keeps a wider range and places a second order only in the sizes and colors that are selling.
The lesson is that the value comes from the process, not from the model alone. For a related apparel project, see how an apparel brand approached inventory costs with forecasting. Clean data, a clear decision, buyer involvement, and honest measurement made the difference.
Reading the study alongside the wider market
A single survey tells you what engaged companies are doing. It does not tell you how big the market is or how returns and losses are moving. For that, it helps to place the USFIA findings next to other US data.
Sales scale. The U.S. Census Bureau's monthly retail trade survey reports sales for clothing and clothing accessory stores. The national series shows about $26.5 billion in seasonally adjusted sales for August 2026, the latest month available in the FRED data series. At that scale, a small improvement in forecast accuracy can free up a meaningful amount of working capital.
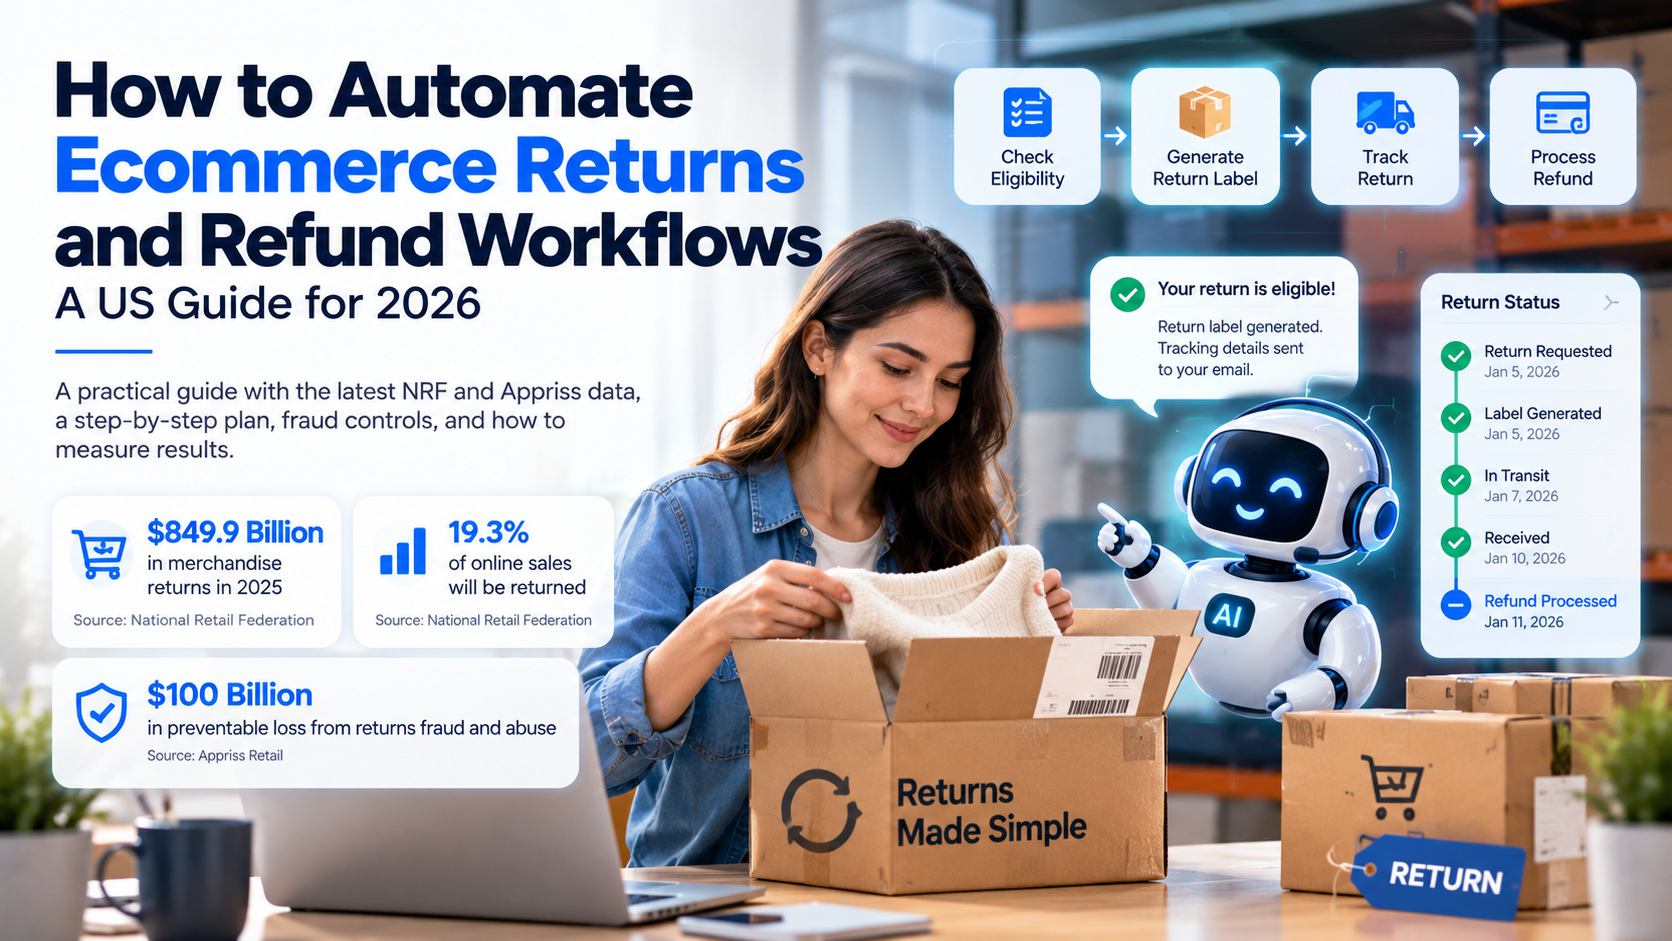
Returns. The National Retail Federation and Happy Returns project that 19.3% of online sales will be returned in 2025, out of $849.9 billion in total merchandise returns. Returned items change the stock picture. They must be inspected, graded, and restocked, or sold through another channel. A forecast that ignores returns can overstate how much inventory is available.
Losses. Appriss Retail's 2026 Total Retail Loss Benchmark Report puts merchandise returned in 2025 at $706 billion. It estimates that 14.2% of returns, or about $100 billion, was preventable loss from returns fraud and abuse. Clean returns data is therefore part of forecast quality, not a separate back-office task.
Read together, these sources point to one conclusion. The demand signal a fashion forecast learns from is noisier than sales alone suggest. Net demand, after returns and after accounting for stockouts, is the number that should drive the buy.
Questions to ask before you hire a forecasting partner
Many fashion teams evaluate forecasting vendors by demo. A demo can look impressive on clean data. Your questions should test how the approach works on your data and your decisions.
- What data do you need, and what happens when it is missing? A good partner can explain how it handles stockouts, returns, and style code changes, not only how the model is trained.
- How do you forecast new styles? Ask to see the cold-start method and how it matches new products to similar past ones.
- How does the forecast reach the buyer? Ask what the output looks like, whether it shows a range, and how buyers can record overrides.
- How is accuracy tested? Ask whether the test uses time-based evaluation on past seasons, and whether it reports bias at the size level.
- What happens after launch? Ask how the model is monitored, retrained, and updated when trade costs or supplier terms change.
- Who owns the data and the output? Confirm access rights, storage, and retention before any data is shared.
- What will you measure with us? Agree on the metrics and the baseline before the pilot starts.
A partner that answers these questions clearly is usually more useful than one that promises a single accuracy number.
A 12-month roadmap for a fashion forecasting program
A phased roadmap helps a team move from idea to routine without overloading the buying calendar.
Months 1 to 2: Define and audit. Choose one category and write down the decision the forecast will support. Audit the sales, inventory, returns, and style code data for that category, and fix the most damaging gaps.
Months 3 to 4: Build the baseline. Measure the current forecast on last season's buys. Set the targets for overstock, markdown rate, core-size stockouts, and bias. Build the first layered forecast for the category.
Months 5 to 6: Run in parallel. Use the new forecast alongside the normal process for one drop. Record every override with a reason, and review the differences with buyers at the end of the drop.
Months 7 to 9: Expand with discipline. If the results hold, extend the approach to a second category, and add cold-start matching for new styles. Automate the data pipelines that feed the forecast, so buyers see current numbers without manual work.
Months 10 to 12: Operate and improve. Move the forecast into routine use, schedule regular retraining, and review the override log each season. Add scenario views for trade policy and supplier changes, so buyers can plan for shifts in cost and lead time.
The roadmap is deliberately modest. Each phase produces something the buying team can use, and each one earns the right to the next.
Common mistakes to avoid
- Quoting the headline without its context. Describe the 56% as a share of respondents to the USFIA survey, not as a share of all US fashion companies.
- Treating zero sales as zero demand. Stockouts must be handled before training.
- Forecasting only the total. Errors at the size level can be hidden inside an accurate total.
- Ignoring returns. Net demand is what determines available stock.
- Skipping the buyers. A forecast that buyers do not trust will be ignored, however accurate it is.
- Changing everything at once. Start small, prove the value, and then expand.
Frequently asked questions
What does the 2026 USFIA study say about AI in fashion forecasting? The 2026 USFIA Fashion Industry Benchmarking Study reports that 56% of its respondents use AI for demand forecasting and inventory planning, the most common AI use in the survey. The study also reports that 50% use AI for sustainability tracking, risk management, and sourcing strategy. The figures describe the survey respondents, who are executives at fashion brands, retailers, importers, and wholesalers.
Does the 56% statistic mean most US fashion companies use AI for forecasting? No. The figure is a share of respondents to a survey of leading companies, which FashionUnited describes as about 30 businesses. It is not a count of all US fashion companies, and it does not measure how many have a forecasting system in production. It shows the direction of adoption among engaged companies.
What data do fashion retailers need for AI demand forecasting? At minimum, you need sales by style, size, color, store, and day, along with inventory and stockout records, product attributes, promotion and markdown history, returns, the drop calendar, and supplier lead times. Landed cost and duty assumptions help connect the forecast to trade policy scenarios.
How do you forecast a new fashion style with no sales history? Match the new style to similar past styles using attributes such as category, silhouette, fabric, color family, and price band. Use those styles' early sales curves as a starting point, and update the forecast quickly as the new style sells. Keep the forecast range wide until the style has enough of its own history.
How can AI forecasting help with tariffs and sourcing changes? A forecast that can be rerun with different cost and availability assumptions helps buyers see how a duty change would affect the optimal buy. It also helps plan supplier volumes when sourcing consolidates around fewer partners. The forecast does not predict trade policy, but it makes the effect of a policy change easier to measure.
How should a fashion retailer start with AI demand forecasting? Start with one category and one season. Define the buying decision, audit the size-level data, set a baseline using last season's results, and run the new forecast in parallel with the current process. Measure forecast error, overstock, markdowns, and core-size stockouts before expanding to other categories.
Next steps
If you are planning a forecasting program for your fashion range, begin with one category and one season of parallel testing. Measure the results against your current process, and expand only when the outcomes hold up across the metrics that matter to your buyers.