MRR and churn differ between teams
Finance calculates revenue from invoices, while the growth team uses product or CRM status, so the metrics do not match.
Impact: Arguments about numbers replace decisions.
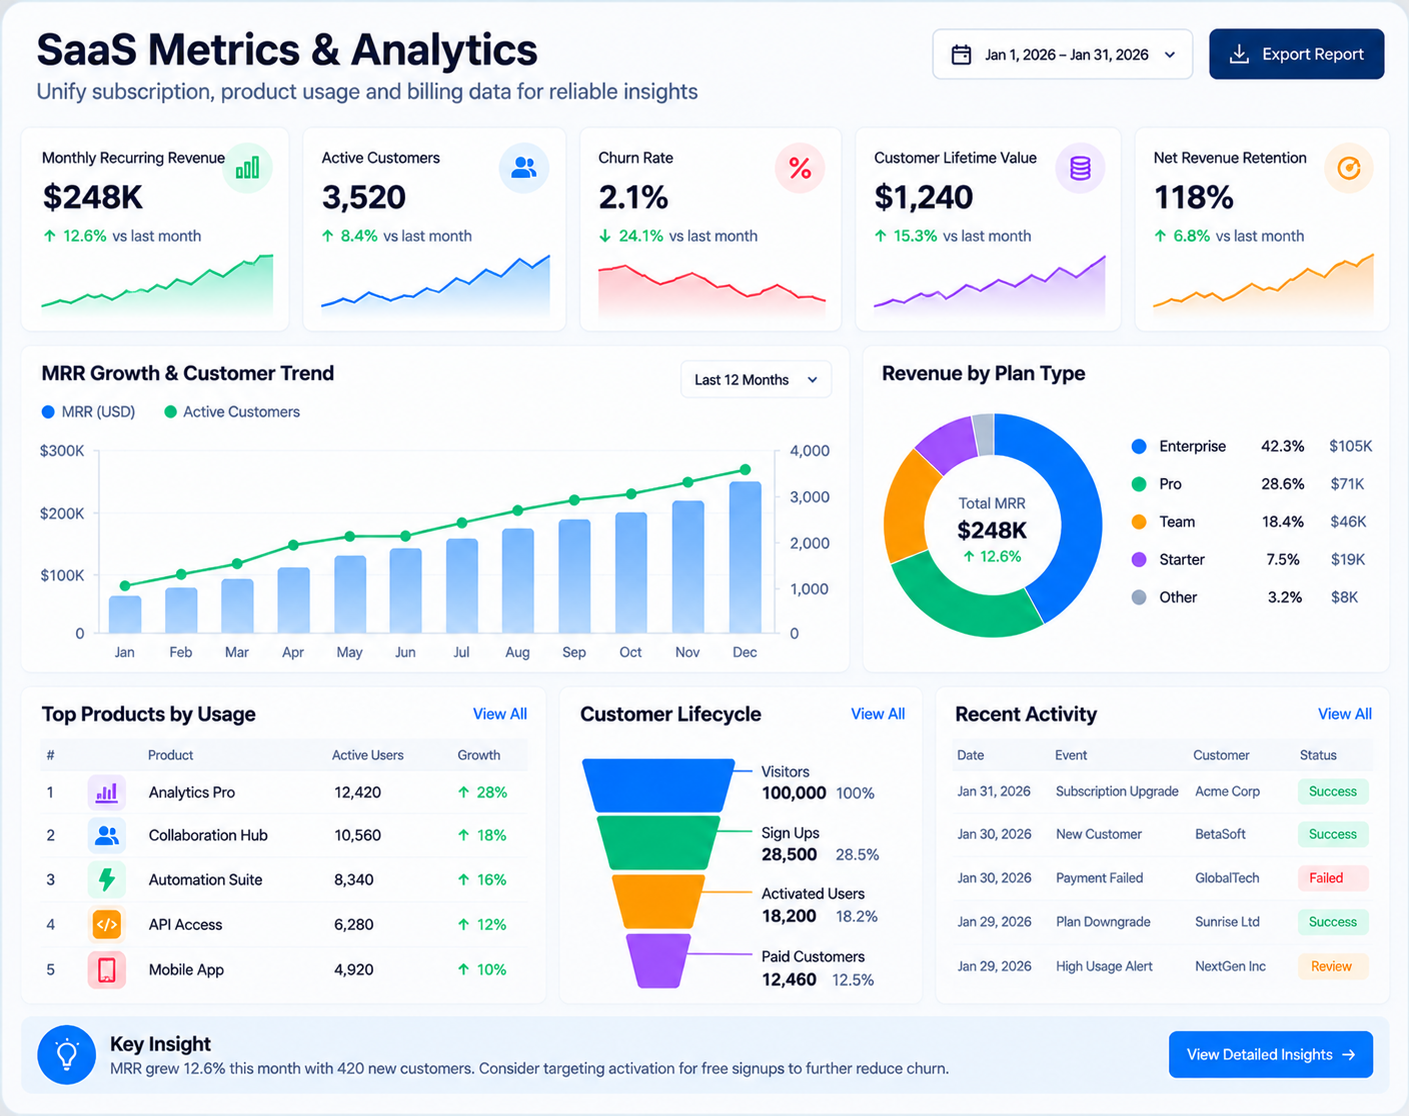
SaaS metrics such as MRR, churn, retention and activation depend on billing, product and CRM data that are rarely aligned. We build a governed analytics layer so revenue, product and customer teams report the same numbers and can act on usage signals early.
The metrics problem
For a subscription business, the most important numbers are MRR, churn, retention and activation. These depend on billing data, product usage events and CRM records, which are held by different tools and updated at different times. Finance may report a different MRR from the growth team, and customer success often learns that an account is at risk only after the renewal date has passed.
We build an account-level layer with agreed definitions and reconciliation to billing totals. Usage trends are linked to renewal dates, which is the starting point for customer churn prediction and for machine learning models on subscription data. The governed data also supports the wider data warehousing and analytics work we deliver for growing software businesses.
Metrics that matter
Each measure is baselined before the project starts, so improvement is shown against your own starting point.
| Measure | How it is calculated | Why it matters |
|---|---|---|
| MRR reconciliation gap | Difference between analytics MRR and billing totals, each period | Shows whether revenue reporting can be trusted |
| Gross and net revenue retention | Retained and expanded revenue as a share of starting revenue, by cohort | Shows the health of the existing customer base |
| Churn flagged in advance | Share of churned revenue that was flagged as at risk before renewal | Shows whether the early-warning view works |
| Activation rate | Share of new accounts reaching the agreed activation event within a set period | Shows the effect of onboarding changes |
| Dashboard breakage | Number of dashboards affected by schema changes without warning | Shows whether change control is effective |
Account-level design
Scheduled loads from billing and CRM, and event streams or frequent batches from product analytics.
An account-level model with subscription history, plan changes and usage aggregates, versioned for schema changes.
MRR, churn, retention and activation definitions implemented once, with reconciliation to billing totals.
Executive metrics, cohort analysis for product teams, and renewal-risk views for customer success.
Where numbers disagree
Finance calculates revenue from invoices, while the growth team uses product or CRM status, so the metrics do not match.
Impact: Arguments about numbers replace decisions.
Event data is stored separately from accounts and plans, so usage cannot be compared with renewal risk.
Impact: Churn is noticed after the customer has left.
Retention cohorts need manual joins between billing and product tables.
Impact: Pricing and onboarding changes are assessed too slowly.
New plans, tracking events or billing providers change the data, and reports stop working without warning.
Impact: Loss of confidence in the analytics team.
Source systems
We confirm what each system exposes, how often it can be refreshed and who owns the data, before the design is final.
Billing platform
Subscriptions, invoices, plans and payments
Product analytics events
Feature use, sessions and activation events
CRM
Accounts, owners, deals and support context
Support tools
Tickets and satisfaction data
Finance and ERP
Revenue recognition and cost data
Dashboards
Delivery
Each phase ends with a defined output. Timelines are estimated after the assessment, once sources and scope are confirmed.
We review billing, product and CRM sources, and agree the definitions of MRR, churn, retention and activation with finance and product.
Output: Metric dictionary and source inventory
We design the account-level model with subscription history, plan changes and usage aggregates, versioned for future change.
Output: Account data model
We build the billing, product and CRM loads, and set up reconciliation to billing totals each period.
Output: Pipelines and reconciliation checks
We publish executive metrics, cohort analysis and renewal-risk views for customer success.
Output: Executive, product and customer success dashboards
We monitor schema and data changes, and review metric definitions when plans or products change.
Output: Monitoring and change log
Change control
Controls are agreed for each project, based on the sensitivity of the data and the rules that apply to your organisation.
Illustrative scenario
This is an illustrative scenario, not a verified client result. Measured outcomes are shared only from real projects, with their baseline and method.
The challenge
A subscription business sees churn in monthly reports, but the product and customer success teams cannot see which accounts are losing usage before renewal.
The approach
What we measure: Share of churned revenue that was flagged in advance, reconciliation gaps to billing, and time to build a cohort analysis. Measured against a baseline.
SaaS questions
Typically MRR, net revenue retention, gross churn, activation and cohort retention. We agree each definition with finance and product before building the dashboards.
Usually, through their APIs, exports or warehouse connectors. We confirm the options and refresh frequency during the assessment.
The data model is versioned and schema changes are monitored, so dashboards are flagged before they break rather than failing silently.
Usage trends can highlight accounts that need attention, but prediction quality depends on your data history. Any model is evaluated before it is used for decisions.
Yes. We run the definition workshop with finance, product and customer success, and document the result so it is applied the same way in every report.
We connect through their exports, APIs or warehouse connectors where available. The options are confirmed during the assessment.
A data platform assessment maps your systems, the reports that matter and the decisions they support, then gives you a practical first step.
Tell us about your business goals and challenges. Our experts will get back to you within one business day with a free, no-obligation consultation.
100+ Projects Delivered
5+ years expertise
Free Consultation
Fill out the form and our team will get in touch with you shortly.
Free
Consultation
Quick
Response
Dedicated
Support